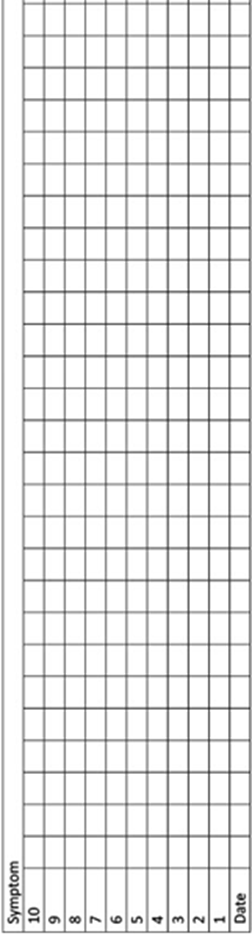
Write the symptoms you are tracking on the top of the graph.
To the right of Date, found on the bottom of the graph, write the date.
Rate the symptoms you are tracking and place an X in the box for that date.
After you have more than 1 X on the graph, draw a line from one X to the next and continue doing this each day. This will begin to show you the trend you are on. Ideally, you will see the line going lower towards number 1.
If you ever have an uptick of more than 2 numbers, have a look at the Journal and notes you have been keeping and look for some change you have made.
Ideas on symptoms to track
Anxiety
Depression
Sleep
Mood
You can narrow these symptoms down further. Such as, irritability, agitation, restlessness etc.
(Note) The printed book contains several of the premade graphs found below.